Jamairoqui Not recently active
abe_event_scores.png
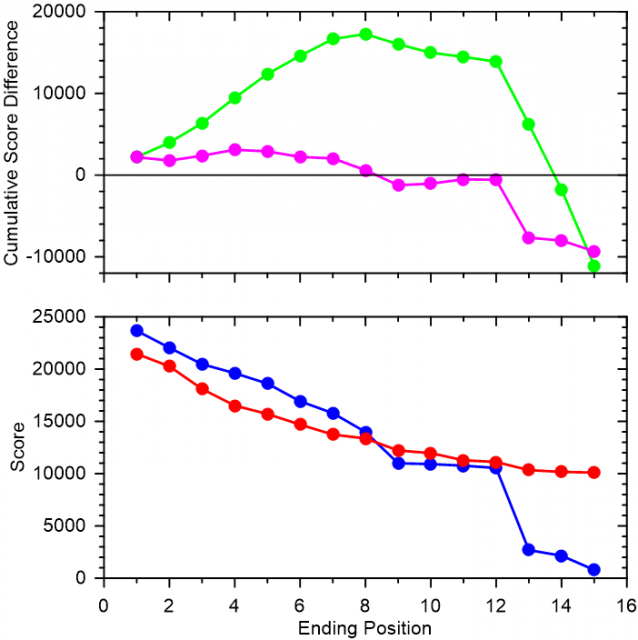
Scores for the team competition March, 2017
The bottom plot shows my team (blue) versus the opponent (red) by finishing position.
The top plot shows the score difference by finishing position:
Us(i) – Them(i) (magenta)
and then the cumulative score difference:
Us(Sum(1 to i)) – Them(Sum(1 to i)) (green)
My team lost because our bottom three people quit after day 1.